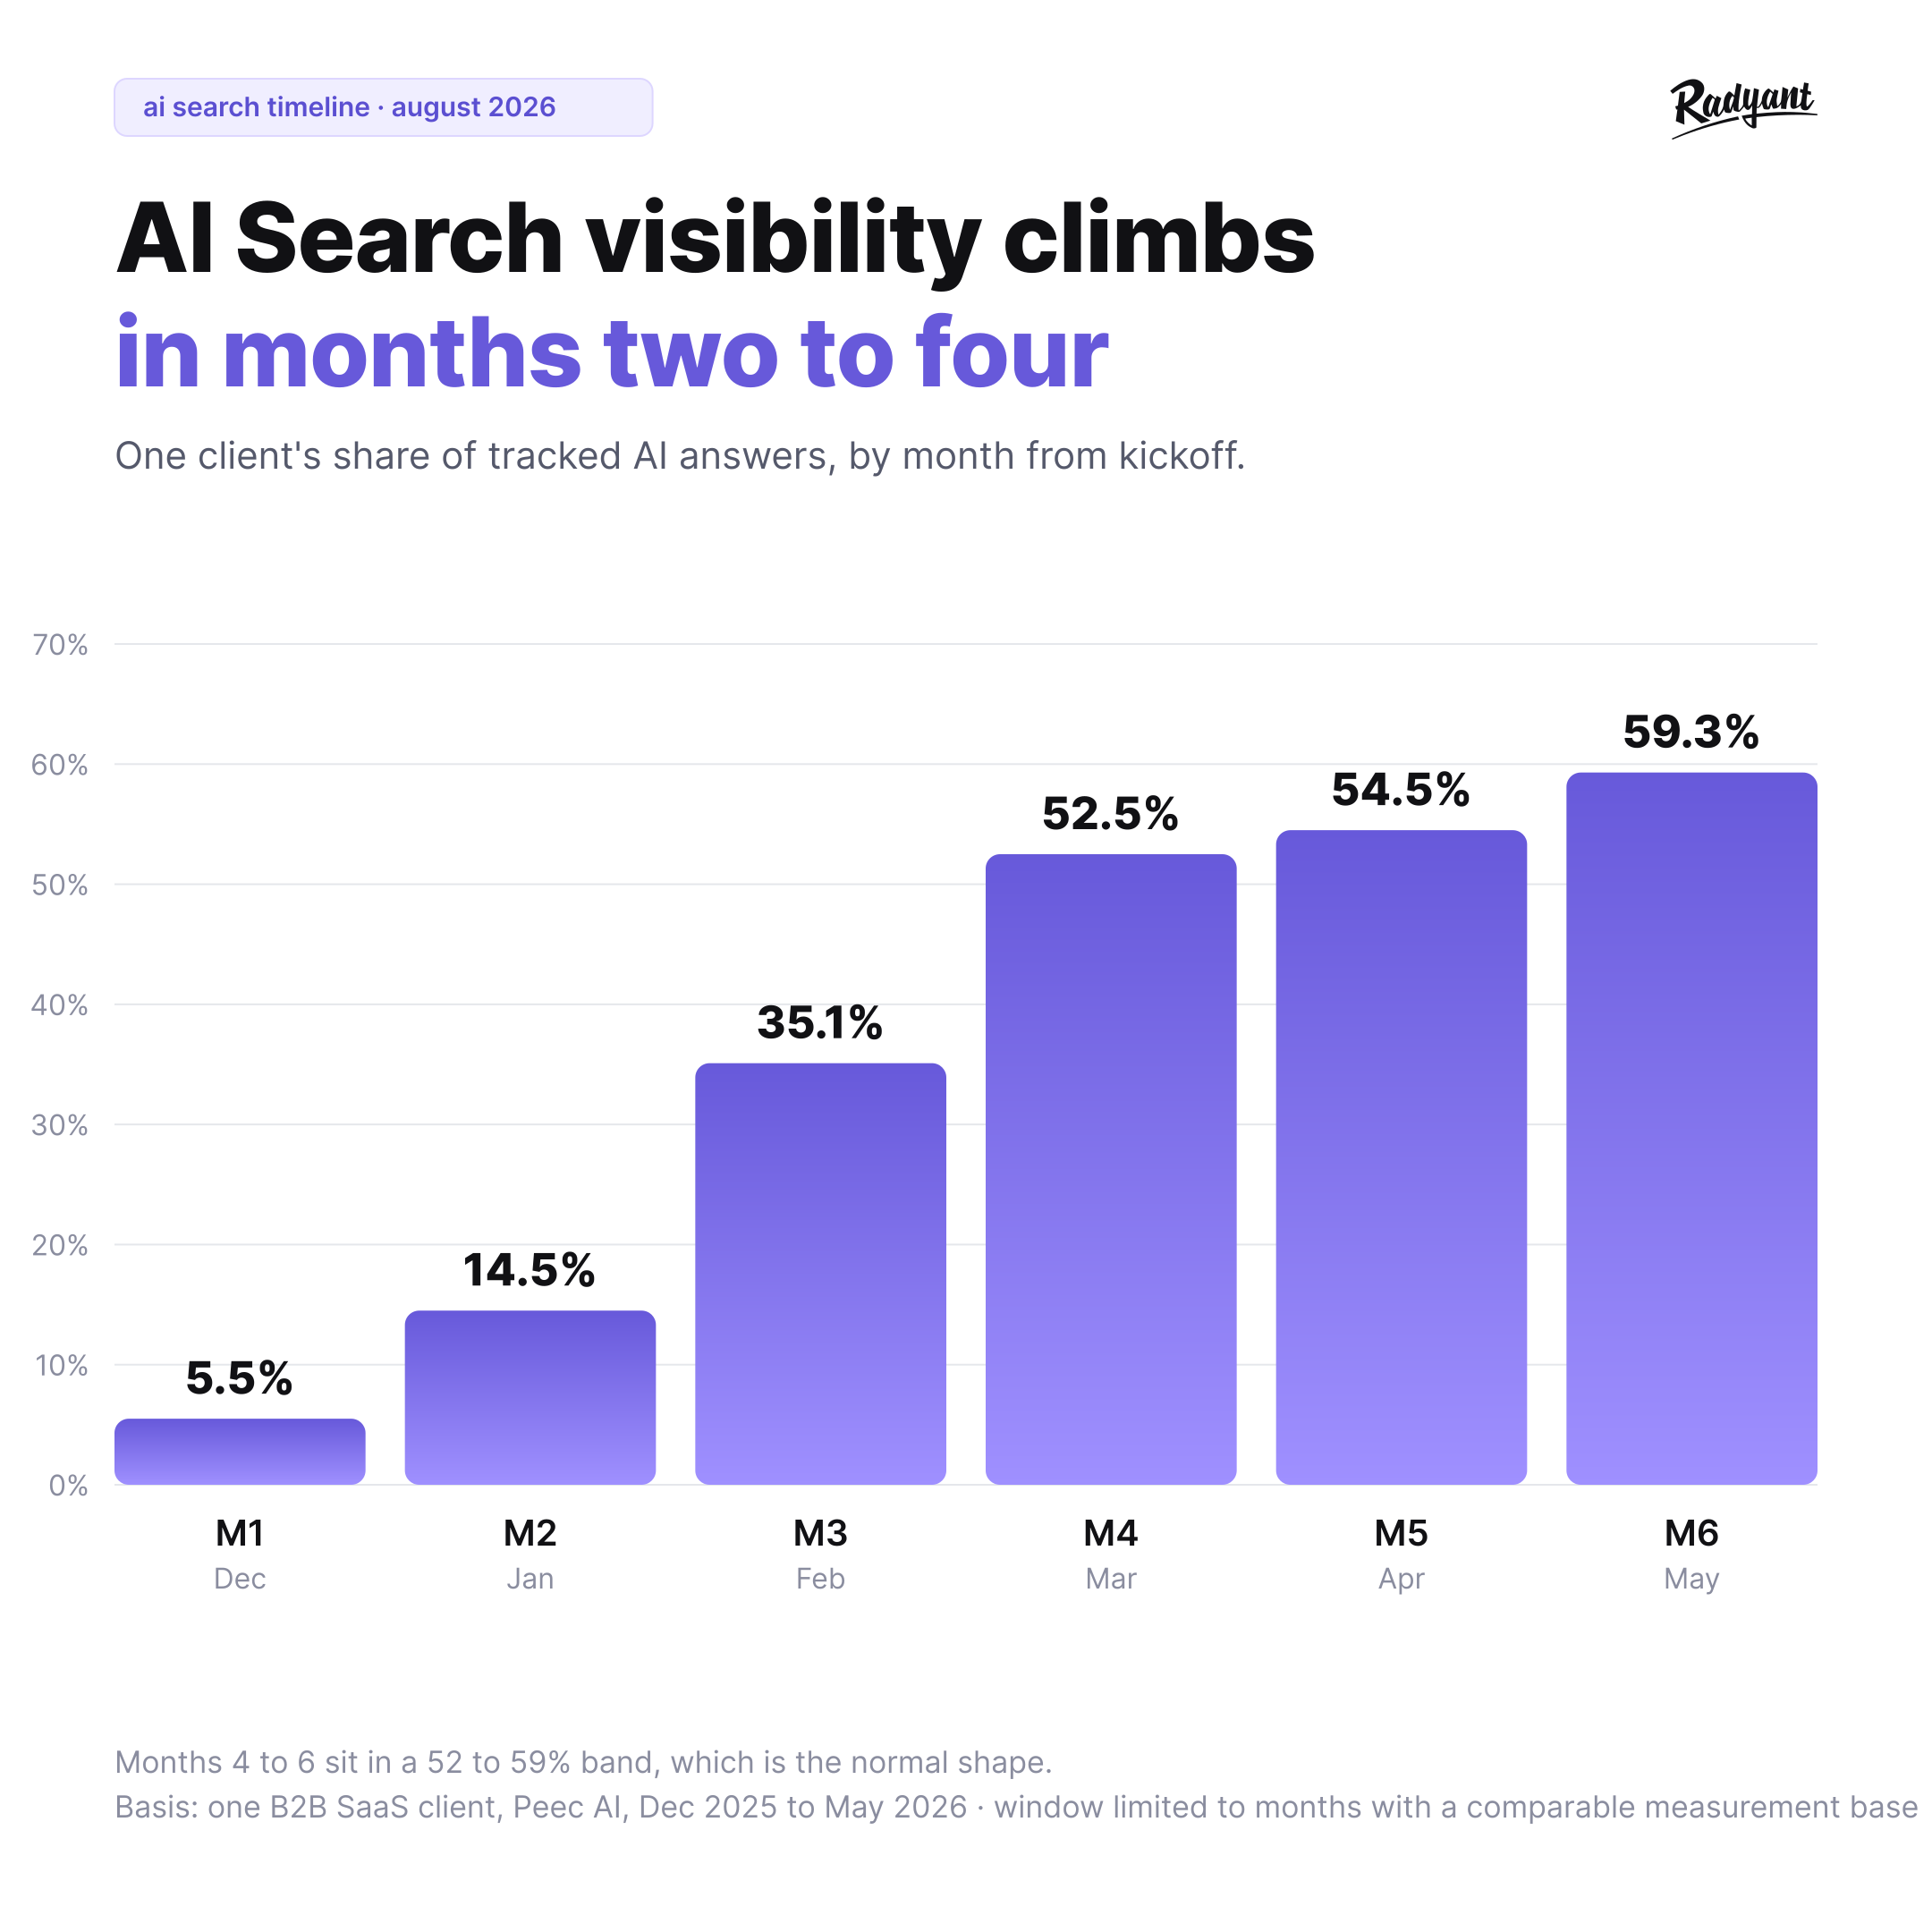
AI Search visibility climbs in months two to four. One client's month-by-month curve, why month one reads as failure, and what to report until it moves.
Almost every first conversation we have arrives at the same question, usually early in the call. How long until this works?
It gets asked in a specific and revealing way. In the same call, the same person will expect AI Search results within days and treat classic SEO as a year-long bet. The real clock runs between the two, and closer to the SEO end than to the days end.
Here is the honest answer, with one client's month-by-month curve behind it. The shape matters more than the date, and month one looks like failure no matter how well the work is going.
Key takeaways
- The climb happens in months two to four. One B2B SaaS client went from 5.5% to 52.5% AI Search visibility between month one and month four. Month one shows you the setup landing, not the results.
- In month one the pipeline can sit below where you started. That client's MRR pipeline from AI leads was 0.7x its pre-kickoff month before it reached 3.3x in month four.
- Pipeline and visibility flatten in the same month. Pipeline peaked at 3.3x in month four, which is the month the steep part of the visibility climb ended, so report the two together.
- A plateau after a fast climb is the normal shape. Months four, five and six sat between 52.5% and 59.3%. The lever that got you there is close to spent and the next step needs a different one.
- Commit to a shape and a band instead of a date. Little visible in month one, the real climb in months two to four, a plateau after that. Anyone handing you a date is guessing.
What moves in days, weeks, and months
Three things happen on different clocks, and conflating them is where most of the confusion comes from.
Days. Technical fixes, metadata, structure. If you already have content that is close to being the best answer and it is badly presented, rewriting titles, descriptions and page structure can move things almost immediately. With one B2B SaaS client we rewrote 20 videos that already existed, under an hour each, and the engines started pulling them in straight away once they went live. What is fast there is the work and the pickup after it, rather than the distance from kickoff. New content cannot move at either speed.
Weeks. New content getting discovered, retrieved and starting to be cited. None of that is on your schedule: the engines have to crawl the material first, and Google alone runs a long list of crawlers with different jobs and different cadences. This is where most of a program's early effort goes and where almost none of its early credit arrives.
Months. Citations turning into sessions, sessions into leads, leads into pipeline. This is the part that gets reported to a board, and it is the last thing to move.
There is an awkward side effect here. The work with the fastest effect is usually the work you can only do once. The work that compounds is the work that shows nothing for a while.
One real curve, month by month
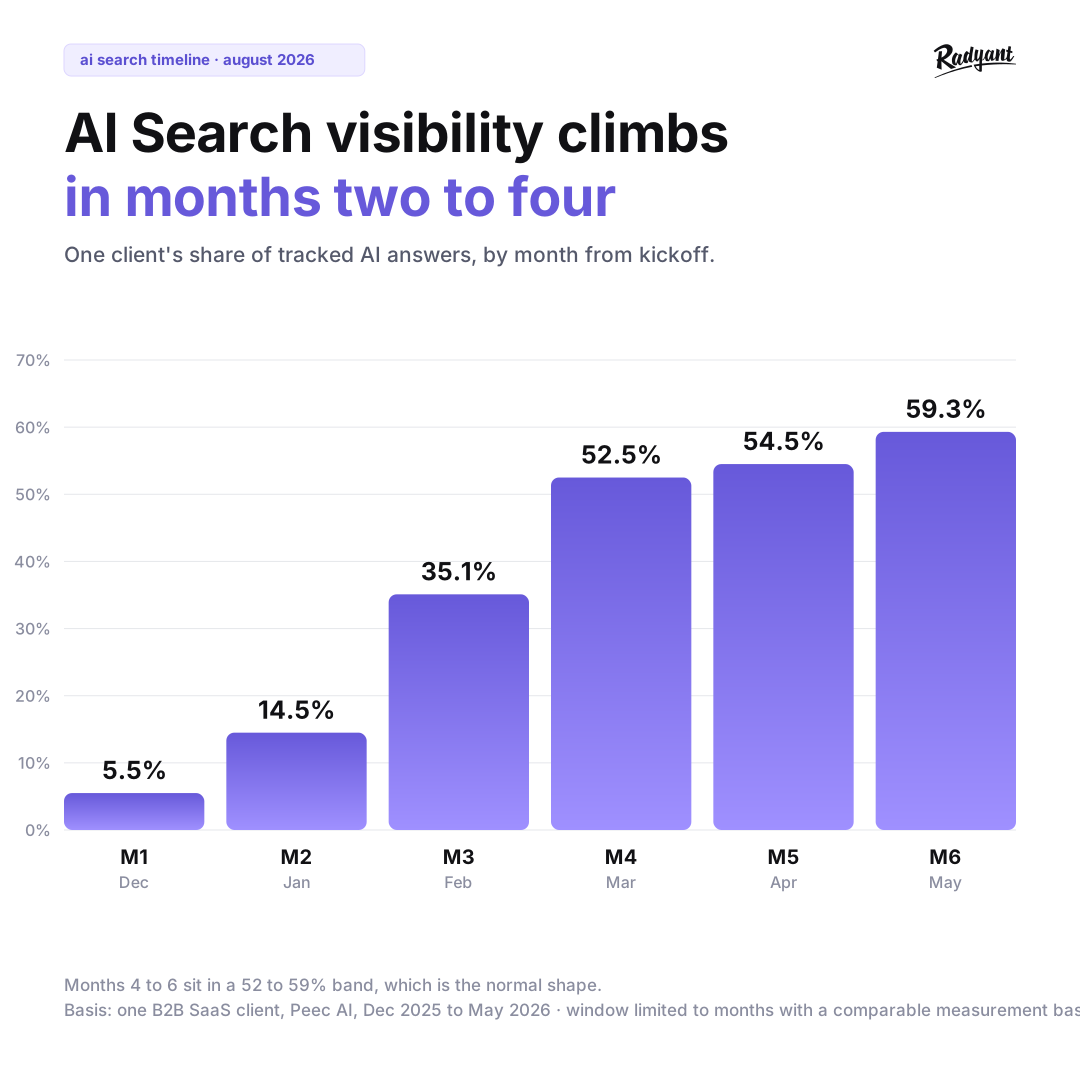
This is one B2B SaaS client's AI Search visibility from kickoff, measured in Peec AI across the prompts we tracked for them in each month. Visibility here means the share of tracked AI answers where the brand appears. The set was non-brand prompts throughout months one to three, with two brand prompts entering in month four, so the later months carry a little brand lift that the earlier ones do not. If you want to build a set you can read this way, that is what a prompt set is for.
| Month from kickoff | Visibility | Average position |
|---|---|---|
| 1 | 5.5% | 3.5 |
| 2 | 14.5% | 2.6 |
| 3 | 35.1% | 2.1 |
| 4 | 52.5% | 1.4 |
| 5 | 54.5% | 1.6 |
| 6 | 59.3% | 2.0 |
Average position is where the brand lands inside an answer when it appears, rather than its rank against competitors.
Three things worth reading off that.
The climb is months two to four. Visibility climbs from 5.5% to 14.5% to 35.1% to 52.5%: more than doubling in each of months two and three, then adding half again in month four. If you judge the program at the end of month one, you are looking at 5.5% and a project that appears to have achieved almost nothing.
Average position improves alongside it, and separately. Reaching 1.4 by month four means the client was appearing earlier in answers as well as more often. Those are two different wins and they arrive together. Position then drifts back toward 2.0 across the plateau, which is arithmetic rather than decline: appearing in more answers includes answers where you are not first.
Then it flattens. Months four, five and six sit between 52.5% and 59.3%, which is the normal shape rather than a stall.
The window is December to May because those are the months we can compare. Before December we tracked too few answers for a percentage to mean much, and after May the tracked set grew roughly tenfold, which changes what the percentage is measuring. The set also grew within the window, from about 800 tracked answers a month to about 1,800, so read the individual steps loosely: the climb-then-plateau shape survives any way we cut the set, the exact percentages move a little.
For scale, AI Overviews only began rolling out to everyone in the US in May 2024, which makes the whole channel younger than most of the programs being measured against it.
Some of that instability is the surfaces themselves rather than our tracking. Google introduced AI Mode as an early Labs experiment in March 2025, opt-in and limited to subscribers, and by the months this curve covers it had become a mainstream surface and was still expanding. Any curve drawn while the surfaces themselves change like that is measuring a moving target, which is a reason to read the shape rather than the precise values.
Why month one looks like failure
At the end of month one you have spent real money, your team has answered a lot of questions, a pile of content and fixes has gone live, and the number you can show is 5.5%.
Nothing is wrong. The work lands before the measurement does. Engines have to crawl the new material, decide it is the best answer to something, and start using it, and none of that happens on your reporting cycle.
This is how good programs get killed. Month one gets reported against an expectation that was never realistic, the conversation turns defensive, and the work gets cancelled before the curve has a chance to move.
The plateau nobody warns you about
The second dangerous moment comes later, and it catches more people than the first.
Visibility does not climb forever. It goes up steeply, then settles into a band. This client flattened into a band between 52.5% and 59.3% from month four. Read month five's 54.5% against month four's 52.5% and it looks like the program stopped working. A single month read against the one before will always look like a stall somewhere, so trust the consistency of the band instead of the month-on-month delta. Treat the band as a phase too, not a resting place: it held for the three months charted here, and a set this young moves again in both directions.
What the plateau reflects is simpler. You win the answers you can win, and what is left belongs to sources that are genuinely better placed, or to questions where nobody is consistently cited. Getting from 5% to 50% is a different job from getting from 50% to 60%. The second one needs new surfaces, new formats and new places engines look, rather than more of the same content.
Two practical consequences. Stop treating visibility as the headline once it plateaus, and switch to what it produced. And expect the next real step up to come from a different lever than the one that got you here.
What the pipeline does while visibility climbs
The same client's MRR pipeline from AI leads tripled over six months. Those are AI Search leads only, people who landed on the site from ChatGPT, Claude, Google AI Overviews and similar tools; leads from every other channel come on top of that figure.
Read month by month against the month before kickoff, it went 0.7x, 1.5x, 2.4x, 3.3x, then 3.2x. Two things in that sequence are worth more than the headline.
Month one came in below the starting point. Not flat, lower. So the month that already shows almost nothing on visibility can also show a pipeline number that has gone backwards, and both are the setup landing rather than the program failing.
Pipeline peaked in the same month the visibility climb flattened, month four, and eased slightly after. We had assumed pipeline would trail visibility by a step, and our own published curves do not show that. They move together, which is better news for reporting: you are not waiting for a second clock to start.
What does not follow automatically is the link between them. Visibility tells you the engines changed their mind about who the best source is. Pipeline depends on whether the people reading those answers are your buyers and whether what they land on converts, which are separate problems with separate fixes, and harder to attribute than either.
What makes it faster or slower
Some of this is genuinely under your control.
Faster: you already have content that is close to the best answer and it is just badly presented. You have an existing library, video, documentation, or help content that has never been optimized. Your category has questions with no consistently cited source yet. You can publish without a six-week legal review.
Slower: you are starting from nothing. One source with real authority owns the answers in your category. You are in a YMYL space where engines are conservative about who they cite. Your approvals take longer than your production.
The biggest accelerator is boring: content you already have that nobody has optimized. Rewriting an asset that already ranks somewhere is hours of work against weeks for a new page, and it is the first thing worth checking before you commit to any timeline.
What we can and cannot say from this
One client is one client, and we picked this one because the curve is unusually clean, so treat the shape as an example rather than a benchmark. Another program we ran took about ten months to reach a comparable AI Search position, and one classic SEO engagement took two years to reach 10× organic leads, a reminder that the older channel runs on an even longer clock.
What holds across all of them: month one shows almost nothing, the real climb lands in the middle, visibility plateaus, and pipeline arrives last. Plan against that shape rather than a date.
The curve shows what happened while we were working. We think the work explains most of it, though we cannot separate it from everything else that moved in six months.
Where that leaves month one
Month one's 5.5% does not kill programs. The meeting where you report it to someone who was promised something else is what kills them.
That meeting is avoidable, and it is avoided in the first conversation rather than the fourth. Agree the shape before the work starts, agree what gets judged at month three and what waits until month six, and the 5.5% becomes a checkpoint instead of a crisis. When a program gets cancelled early, it is usually cancelled on a number that was doing exactly what it should.
FAQ
How long until we see the first AI Search results?
If you have existing content that is well-matched to real buyer questions but poorly presented, days to weeks for the work itself and for the engines to pick it up once it is live. The headline number is a different clock: one client we track sat at 5.5% at the end of month one, so early movement and a month that looks like failure on a dashboard are the same month. If you are starting from nothing, expect the first meaningful movement in month two or three.
When should we judge whether the program is working?
Month three, on visibility. Month six, on pipeline. Judging outcomes at month one measures your setup, not your results, and it is how good programs get cancelled.
Our visibility has stopped climbing. Is something broken?
Probably not. Visibility rises steeply and then settles into a band, and a plateau after a fast climb is the normal shape. What it does mean is that the lever that got you here is close to exhausted, and the next step up needs a different one: a new surface, format, or content type rather than more of the same.
Why does pipeline take longer than citations?
They are different problems, though not as sequential as we used to say. In the engagement charted above, pipeline peaked in the same month the visibility climb flattened. Visibility means the engines changed their mind about who the best source is; pipeline means the people reading those answers are your buyers and what they land on converts. The second does not follow automatically from the first, which is why we track both.
Can you promise a date?
No, and anyone who does is guessing. Nobody can guarantee you when the climb lands; what can be guaranteed is the other direction, that judged against a date, good work will look like failure at least once on the way up. What is reasonable to commit to is a shape and a band: little visible in month one, the real climb in months two to four, a plateau after that, pipeline following later. We set a target number together and report honestly against it, including when we are behind.
What makes the biggest difference to the timeline?
Existing assets nobody has optimized. An unoptimized video library, help center or documentation set is the fastest thing we can act on, because the content already exists and only its presentation is holding it back. It is worth auditing what you already have before committing to any timeline.